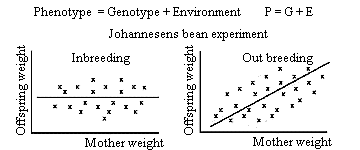
Figure 1.4
Relation between phenotype, genotype and environment have been formulated by W. Johannesen based on the shown bean experiments.
Most quantitative traits exhibit some degree of heritability. The heritability is evident when individuals, deviating positively or negatively from the average, also become offspring with deviation in the same trait in the same direction as their parents. There is a continuum of some traits, which is inherited with a simple Mendelian form and other traits with quantitative genetic inheritance without separate classes. The quantitative genetic inheritance is caused by the effect of many different genes, each with minor effect. The traits are also under the influence of environmental effects.
The similarity between related individuals is determined by the degree of heritability. The degree of heritability can be
estimated statistically as a regression of offspring on average parents. The degree of heritability has values
between 0 and 1. The degree of heritability at 0 corresponds to no similarity, and 1 corresponds to the highest
possible similarity between parent and offspring. See right side of Figure 1.4.
Figure 1.4 Relation between phenotype, genotype and environment have been formulated by W. Johannesen based on the shown bean experiments. |
The upper part of Figure 1.4 gives the relation formula for a trait or the entire individual the Genotype (all genes inherited from the parents) and the phenotype (appearance or what can be measured in the individual). The deviations of the phenotype from the genotype are caused by random environmental effects. The formulation was made by the geneticist Wilhelm Johannesen, employed by this university around year 1900. The formula was based on the size of bean seeds derived from beans with varying degrees of inbreeding.
Figure 1.4 shows what Johannesen discovered: When the beans were 100 % inbred, which means that all beans were genetically similar, there was no relation between the weight of the parent bean and that of its offspring, i.e. the regression coefficient (b) of offspring on parents equaled 0. For outbred beans being genetically different, there was a linear regression of b = 0.27. Which means that if a bean was 10 mg larger than average then the offspring was 2,7 mg larger than average.
Figure 1.5 Relationship between the height of parent and offspring (vet. students). If the average height of the parents is 1 cm above the average, their offspring is 0.6 above the average. The relationship is caused by the fact that height, as a trait, is passed down with a heritability of 60 %. The symbol 1 is the boys and 2 is the girls. 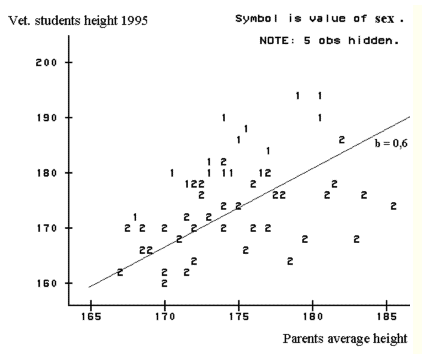 |
Figure 1.5 shows that there is a strong relationship between the height of the parent and that of their offspring. The relationship equals a degree of heritability of 60 % for the trait height in the human population, cf. the slope of the regression line which is b = 0.6.
The Genotype can only be observed when genetic variation occurs. This variation is equal to the part of the phenotype (the phenotypic variation) which can be passed down to the offspring (genotypic variation). The genotype constitutes respectively 27 % of the phenotypic variation for bean weight and 60% of human height. The environmental effects thus contribute to the rest of the variation. That is (100-27)= 73 % for bean weight and (100-60) = 40 % of the phenotypic variation for human height.