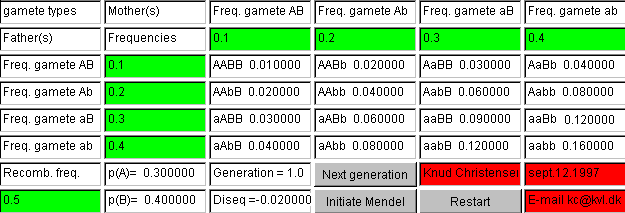
The term gamete frequency is applied when the alleles from more than one locus are considered. Every new gamete contains an allele from each locus. Consider the two loci, A and B, the genotypes on each locus can occur in H-W proportions, even though this is not the case for the two loci together. This can be of great significance in relation to marker genes (loci). Occasionally a specific allele on the marker loci occurs with the disease allele of another locus. If the two loci are closely linked it could take several generations before equilibrium is reached between the two loci.
The combination of two gene pairs, A and B, each with two alleles are shown below in the classical two-by-two table, where r, s, t, and u are the observed gamete frequencies of the gametes AB, Ab, aB and ab, see Figure 2.5.
         gene A   gene B       B              b            frequency
                 ------------------------------------------------
	   A	     |	r=p(A)*p(B)+D	 s=p(A)*q(b)-D  |   p(A)
	   a	     |	t=q(a)*p(B)-D	 u=q(a)*q(b)+D  |   q(a)
	         -----------------------------------------------
	Frequency  | 	 p(B)		  q(b)	          |    1
Gene frequencies can be calculated by means of the gene counting method and they correspond to the border distributions. The expected frequency of a gamete is the product of the border distributions which is equal to p(A) = r + s = p(A)*p(B) + D + p(A)*q(b) - D = p(A)[p(B) + q(b)] = p(A). The deviation which occurs between observed and expected numbers is assigned the symbol D (Disequilibrium). Note that the deviations are the same size for all cells (D), but with a negative sign for the repulsion phase gametes, Ab and aB.
A calculation example: The observed number of gametes is AB=21, Ab=49, aB=19, ab=11.
gene A/gene B 	 	B	         b              Sum (Freq)
          ------------------------------------------------------------
    	  A	   |   21  (r=0.21)	49  (s=0.49)   |  70  (p(A)=0.7)
   	  a	   |   19  (t=0.19)	11  (u=0.11)   |  30  (q(a)=0.30)
          -------------------------------------------------------------
    Sum (Freq) |   40 (p(B)=0.4)	60  (q(b)=0.6) | 100    1


Frequencies are given within brackets:   Chi-squared  = 9.7** Df=1
 				      D= u-q(a)*q(b)=0.11 - 0.3*0.6= -0.07
Statistically significant deviation occurs from random combination between the genes A and B corresponding to a
disequilibrium equal to -0.07.
The corresponding gametes from the first table can be organized differently as shown below:
         gamete   observed frequency   expected frequency   deviation
         ------------------------------------------------------------
	   AB		r		  p(A)*p(B)		D
	   Ab		s		  p(A)*q(b)	       -D
	   aB		t		  q(a)*p(B)	       -D
	   ab		u		  q(a)*q(b)		D
In the table below all possible genotypes in a two gene systems are shown. Physical recombination only has significance in the double heterozygotes, in all other genotypes a recombination would not give rise to other types of gametes than those from which they are formed. The corresponding genotype frequencies under random mating are obtained by multiplication of gamete frequencies as shown. The multiplication is done by means of an applet designed to study linkage and linkage disequilibrium.

Figure 2.5 shows the two types of double heterozygotes. By recombination gametes of the
other
type is formed and reverse. Therefore there is linkage equilibrium when equal numbers of the two types of double
heterozygotes occur. This can also be seen in the formula for D given below.
Figure 2.5. The two homologous chromosomes in linkage and in
repulsions phase. When recombination takes place (with
a frequency c) the opposite gamete is formed
 |
The expected frequency of a specific gamete corresponds to the frequency where the two genes are inherited independently. In that case the multiplication rule for probabilities can be applied to calculate the expected numbers. The disequilibrium has the symbol D and is defined as shown above (observed - expected gamete frequency). It can also be calculated as half of the difference between the frequencies of double heterozygotes in linkage and repulsions phase:
        D = u  -  q(a)*q(b), or
	D = r*u - t*s    (= [p(AB/ab) - p(Ab/aB)]/2)
The maximum disequilibrium exists when all double heterozygotes are in linkage phase (AB/ab) or in repulsion phase (Ab/aB); then it has the value DMax.
If the recombination frequency is c, D will be inflated to D*(1-c) per generation, so in the n'th generation Dn
= D0*(1-c)n, where D0 is the disequilibrium in the base population, see figure 2.6.
Figure 2.6. Curves of number of generations towards equilibrium for different recombination frequencies. |
For two independent loci having .5 in recombination frequency 4 to 5 generations will pass before equilibrium is reached. Concerning closely linked loci with less than 5 % recombination, it will take more than 25 generations before equilibrium is reached.
The release of linkage disequilibrium can produce new genetic variation for quantitative traits. If two loci are linked, both carrying a positive and a negative effect and exist in linkage phase, new variation arises if the positive alleles are recombined to be in linkage phase
Mendel's second law predicts that two loci would segregate independently in F2 in an analysis cross. This is caused by the fact that all individuals in F1 are double heterozygotes. Since only the double heterozygotes can recombine, it will take long time before equilibrium arises in a mixed population, where the frequency of the double heterozygotes is only 2(r*u + t*s).
In relation to a new mutation complete disequilibrium exists in several future generations, as the mutation arises in only one chromosome. This disequilibrium can be used in relation to application of gene markers to identify the localization of the gene and to identify carriers in related individuals by means of the marker locus.
Within a family maximum disequilibrium always occur. This makes it possible to utilize marker genes within families. If an individual is born with a recessive disease and has a specific marker combination, new offspring having the same marker gene combination, would with great probability also carry the disease.
Applet for calculation of Chi-square test for linkage disequilibrium, click here, and Applet for studying linkage and linkage disequilibrium, click here.