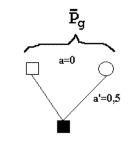
Estimation of breeding value indexes based on regression of phenotype measurements (average of a uniformly related group of P's). The definition of the parameters, see above. An example of use of the formulas is given in Figure 7.2.
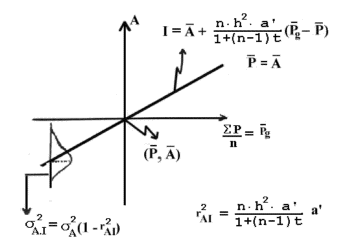
Figure 7.1 shows the relationship between phenotype measurements of a
uniformly related group of individuals, P's, and the breeding value index (I), which is an
estimate of the true breeding value (A). Additionally the figure shows the significance of the accuracy (rAI), as the accuracy squared for the index is equal to a
reduction of the variance of the estimated breeding value. All values can be interpreted
by use of the classical regression equation:
P's = phenotype values of the trait
n = number of measurements
Pg bar = average of a uniformly related group of P's
a' = degree of relationship between the P's and the animal being estimated for
the index
a = degree of relationship between P's
P bar = average of the population
A bar = average breeding value of the population = P bar
h2 = heritability
c2 = common environmental factor for the P's
t = a*h2 + c2 as defined in section 6.4
| Figure 7.1. Estimation of breeding value indexes based on regression of phenotype measurements (average of a uniformly related group of P's). The definition of the parameters, see above. An example of use of the formulas is given in Figure 7.2. |
|
The estimated breeding value or the index (I) can be calculated by means of the formulas given in Figure 7.1. They can be used in all possible combinations of relationship. It only requires uniform relationships. The index depends on the two coefficients of relationship (a' and a), the number of measurements (n), the heritability (and common environment) and the phenotypical average (Pg bar) of the phenotypes. The accuracy (rAI) of the index does not depend on the last factor.
| Figure 7.2 shows a diagram of relationship and a calculation of estimated breeding value for milk yield for a bull based on 20 half sib daughters with an average milk yield of 7500 kg. |
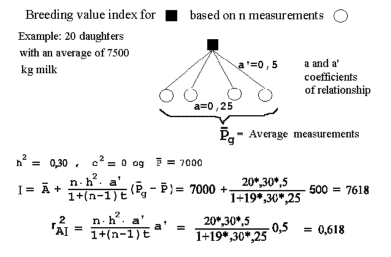 |
Figure 7.2 gives an example. It is a genealogical diagram with the relevant coefficients of relationship for calculation of an estimated breeding value for milk yields for a bull based on the records of 20 progenies being half sibs (a progeny test). The genealogical diagram is made so that the phenotype measurements, the P's, have an blank circle. For the bull being examined the square is filled in.
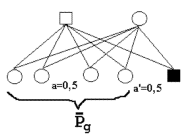
Below are three additional examples of diagrams of relationship defining the coefficients of relationship of uniform relationship. Additional diagrams would be superfluous since the parameters are here given for additional examples.
Figure 7.3.
 |
 |
 |
| diagram of index based on half sibs. | diagram of index based on full sibs. Both parents have the same relationships as a full brother. Therefore, the index is the same for a brother or either of the two parents. | diagram of index based on the parents. |
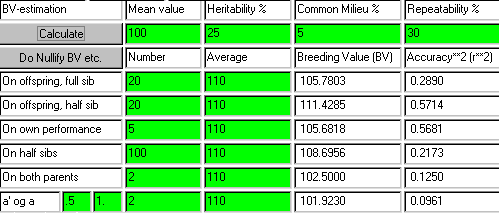
In the table below are given the parameter values of several examples of index calculation in cases concerning uniform relationship conditions. The relevant coefficients of relationships are put into the formula. And when an infinite number of observations are present, the limit value is placed as the regression coefficient and the squared accuracy.
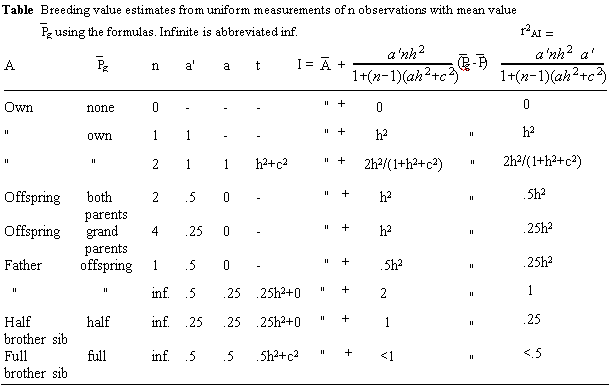
The table parameters are defined in relation to Figure 7.1. Any animal, having the same coefficient of relationship, a',
as the measured group, would also have the
same estimated breeding value. A full brother, the father or the mother, for
instance, have a' = .5 to the same full sib. Or a father, evaluated through an offspring,
has the same formula as a son evaluated through the father.
Line 1 in the table corresponds to the formula having 0 measurements, and the index
equals the population mean with an accuracy of 0. This presents the 'basis' for evaluation of all the other indexes.
Line 2 in the table correspond to a very common situation. This is normally called a phenotype test. The
animal's breeding value is based on measurements of the
animal - the equation is:
I = A(bar) + h2(P -P(bar)) with a squared accuracy of h2.
Line 3: Two measurements of the animal, which could be litter size in first and second litter. The correlation between repeated measurements is called the
coefficient of repeatability. This always contains some common environmental effects for the two measurements.
Line 4 shows the relationship between the average of the parents and the offspring. In section 6.4 this relation was used to estimate the heritability.
Therefore it is no
surprise to see the same formula again.
Line 7 shows the evaluation of a father based on an infinitely large number of offspring.
This corresponds to the definition of breeding value and
the weight factor equals 2 and the
accuracy squared is equal to 1, this line correspond to the definition of breeding value given in chapter 6.
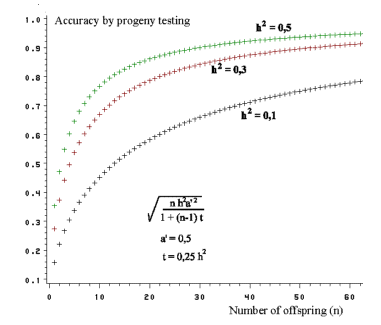
| Figure 7.4. Accuracy of progeny testing - depending on the number of offspring and the magnitude of the heritability |
 |
Accuracy of estimated breeding value
Figure 7.4 shows the accuracy of progeny testing based on n offspring. From the
curves it becomes evident that there is larger accuracy at higher
heritabilities than at low ones. An increase in the number of offspring can compensate for the low heritability.
Some general remarks
should be added about the accuracy of estimated breeding value. By scrutinizing
the formula for accuracy it becomes clear that:
1) For traits with high heritabilities the phenotype of the individual is a good source of information.
2) For traits with low heritabilities the use of several measurements can
compensate for poor accuracy in a single measurement. This is only possible when
large groups of offspring of full and half sibs are measured.
Below is a table and the appropriate action to take depending on the magnitude of the heritability
Heritability   Size 		 Example                   Selection
-----------------------------------------------------------------------
High        Greater than 45%   Fat deposition, milk fat %   Individual
Low         Less than    10%   Reproduction traits          Progeny test
Middle                15-40%   Growth                       Mixed
-----------------------------------------------------------------------
An applet for calculation of the most common cases of estimated breeding value is found here, and an example of the use of it is shown below. From the example it becomes clear that an offspring group of 20 half sibs makes a useful source of information.