shows a two-dimensional distribution with a negative correlation of -.5. The line indicates a selection limit when both characters have the same weight.

The effect of alleles in one locus can affect more traits. This implicates, that if changes by selection occur in one trait other traits will also be changed, namely those affected by the same genes. Often surprising results will occur. Therefore it is important that, in a selection program, the overall phenotype of the animals are maintained in an acceptable style to avoid unwanted secondary changes. The ideal is selection for one trait and proportional change in all the others, thereby maintaining a harmonic phenotype.
If some degree of relation exist between changes in two traits, they are said to be genetically correlated. The genetic correlation can be negative or positive, with a magnitude from -1 to +1. The genetic correlation has the symbol rA1,A2, A1 and A2 being the breeding value of the two traits, 1 and 2.
An example from beef cattle breeding. Selection for fast growth is a common goal of selection. By doing so it is hard to avoid a change in the final adult weight. At the same time, the selection will also result in larger calves being born, which can cause difficulties during calving if the ratio between the weight of the calf and the cow is changed unfavorably.
Figure 8.6 shows a two-dimensional distribution with negative genetic correlation of 0.50 between the traits X and Y. The selection limit (the line) is laid so both traits have the same weight. It can be difficult to change both traits in a positive direction due to the negative genetic correlation. It is very easy, on the other hand, to get good results from the selection if both traits are genetically correlated positively, with respect to the direction of selection.
| Figure 8.6 shows a two-dimensional distribution with a negative correlation of -.5. The line indicates a selection limit when both characters have the same weight. |
 |
When selecting for more than one trait, one of the following selection criterions can be used:
Tandem selection occurs by selection of one trait at the time.
By independent selection the selection limits for each trait are placed independently.
By index selection the traits are weighted in relation to their economic significance.
It is difficult to estimate the genetic correlation, as it can vary a great deal from one population to the other, it also varies to a greater extend over time than the heritability. Here is, non the less, a formula for estimating the realized genetic correlation. When the trait x is being selected for and trait y are changing at the same time, the genetic correlation can be estimated as:
rAx,Ay = (delta Gy/sigmaAy)/(delta Gx/sigmaAx)
The genetic correlation is estimated as the ratio between the standardized selection responses, when only trait x is selected for, and trait y follows passively.
After selection through many generations the selected trait and 'fitness' have a tendency to become genetically negative correlated. As a result of this, and the passing of time, the trait has to be put under selection pressure in order just to keep it on the reached level. If selection is abandoned the population will slowly return to the starting point with optimal fitness.
To avoid this negative effect some environmental changes might keep the population in balance on a level that differs from the starting point, see Figure 8.7.
| Figure 8.7 shows that if a trait changes dramatically, it is often necessary to change the environment too in order to maintain maximum effect of the selection by utilizing the interaction between genes and environment. |
 |
When significant changes occur in both the environmental and the genetic background, the interaction between genetics and environment become an important factor. Interaction is reflected in the negative correlation to fitness.
Selection experiments to illustrate genetic correlation.
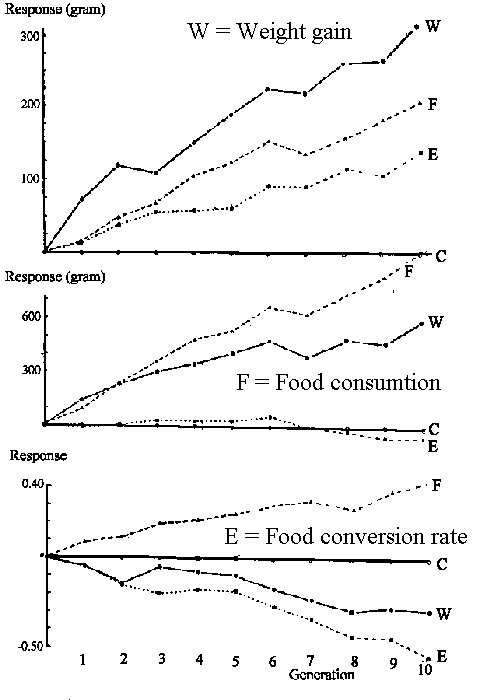
Figure 8.8 shows three parallel selection experiments with broilers, they have been carried out
by the Australian, Pym. The results were published in 1982. The experiment was
carried out through 10 generations and the animals were tested from when they
were 5 weeks old, till they reached 9 weeks. In the three experiments there were
selected for respectively Weight gain (W), Food consumption (F) and Food conversion rate (E). The curves
for the
three characters have the symbols W, F and E.
The direct selection response was measured at the same time and also how the other non-selected characters have changed due to genetic
correlation. Furthermore it is clear that the selection has resulted in quite different phenotypes, depending on which trait
the selection was for.
| Figure 8,8 The Australian, Pym, have carried out three parallel selection experiments with broiler. The direct response is indicated in the title of each graph. The upper 'weight gain', the middle 'food consumption' and the lower 'food conversion rate'. All other curves are correlated responses. |
 |
Animals selected for growth (upper graph W) also has a larger intake of food
(middle graph W) and a better efficiency (lower graph W) with a lower food
consumption per kg weight gain.
Animals selected for food consumption (middle graph F) also has a bigger weight gain (upper graph F) and poorer efficiency (lower graph F) which mean
higher food consumption per kg weight gain.
Animals selected for efficiency (lower graph E) also has a larger daily gain (upper graph E) and a stable food intake (middle graph E).
Video clips of broilers selected for daily gain with correlated leg problems, (demands installation of Real Audio)
The video clips are from a broadcast from DR 'Journalen' and is recorded at Denmark Jordbrugsforskning, Foulum, where prof Poul Sørensen has provided
the basic information.
Video clip of broilers selected
for daily gain and a corresponding layer chicken. At five weeks the white broiler weighs around 2 kg, which is about
four times the weight of the brown layer chicken
Video clip of broilers
selected for daily gain with correlated effects that produce leg problems. The first shown broiler's
leg problems are so severe, that
it is unable to get food and water, thus it ought to be euthanised. The second broiler
walks badly, and keeps its balance by putting its feet wide apart.
Auto selection for the trait, litter sizes - balance with fitness.
In every generation an auto selection for higher litter size will occur, as more offspring
are born in large litters than in small ones.
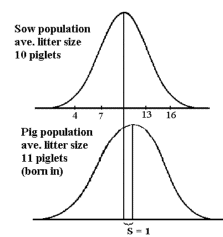
The selection differential in pigs is about 1 pig per generation,
see Figure 8.9. The trait litter size is normal distributed when
observing the trait in the sows. But the curve for the trait born in litter size is
skew to the right, as more piglets are born in large litters than in small ones.
| Figure 8.9 the trait litter size is normal distributed when observing the trait in the sows. The piglet's distribution it is skew to the right with a mean value of one additional piglet. |
 |
The maternal effect is positive for the pigs born in small litters, while it is negative for pigs born in large
litters. In the selection of gilts it is important to avoid individuals born
in large litters. The negative maternal effect is especially pronounced in species,
which become sexually mature before they are fully grown, which is the case for pigs.
It must be clear that all multipara animals need a mechanism to maintain an optimal litter size, even though
a strong selection for larger litter sizes always is present.
Relapse after relaxed selection for traits, which are part of fitness.
If a trait has been changed by selection, the trait has a tendency to return to the starting point
if the selection is discontinued. The domestic swine, for instance, has a litter size around 10, whereas
their origins, the wild boars, only have a litter size of 5. Therefore it is to be expected,
that if the
domestic swine returns to nature, their litter size would adapt itself to the new situation
where less resources are available. The same can be expected considering dairy cows, egg layers and broilers.
The highly specialized domestic animal species can only maintain their large production
if housing and high quality fodder is provided.