8.3 Selection of threshold traits
Preceding page
From chapter 1 shall be repeated that a threshold trait is inherited as a quantitative
trait, containing the feature that it occurs as an either or trait. For instance
are mastitis in dairy cattle or a heart anomaly in a new-born puppy threshold traits.
Whereas the number of outbreaks of mastitis in a cow can be regarded as a semi quantitative trait, particularly
seen on the back-ground of an entire life-span with
many lactations. Concerning the number of mastitis cases, there is no doubt, that
some linearity occur between the number of cases and the animal's
resistance to the disease.
In other cases it is more difficult to imagine a linear scale. For instance
in the so called 'stick and feather test' for mink, designed to test
their reaction patterns. The
possible outcome of the test is aggressive, curious or fearful, all of which
can be seen from the same test. Is it relevant to put the three classes on the same
linear scale and if so how?
To get a meaningful result from such a test three independent either-or
scales has to be used. 1) Aggressive or not aggressive, 2) fearful or not fearful, and
3) curious or not curious, see Figure 8.2.
| Figure 8.2. The three characteristics aggressive, curious and fearful cannot be interpreted
from a linear scale. Each of them has to have its own either-or scale. |
 |
An example of the use of a semi-linear scale: Hip dysplasia (HD) in German Shepherd dogs
from Andresen et al. HD index: Bedømmelsen bør bruges
efter hensigten. Hunden dec.1994.
Figure 8.3 shows an example, which deals with Hip dysplasia (HD) in German
Shepherds. Here is data from a population of 1406
X-rayed dogs. All the dog's hips were evaluated on a scale from E2, E1 to A2, A1,
10 classes all in all as shown in the figure. E2 dogs have a very high degree of
HD, and A1 dogs have perfect hips. Dogs from B2 and below have HD in an increasing
severity.
As can be seen in Figure 8.2, the scale is not linear when the data is fitted
into a normal distribution. In the calculation of the HD index, class mean
has been used instead of a completely linear ten step scale. The class mean has been determined from the normal distribution with
a mean value of 0 and a standard deviation
of 1.
Figure 8.3
A partly linear scale is used to graduate the severity of HD. The number in
each class is adapted
to the normal distribution.
|

|
The estimation of the breeding value (HD index) of a male on the basis of 15 offspring is shown below. The offspring had the scores 4 A2, 9 B1, 1 B2 and 1 D1 with a
mean value of .2933. To rescale the breeding values, 100 is added and the deviation is multiplied by 100. Animals with an index
higher than 100 are better
than the average. The actual calculation of the breeding value is done accordingly to the formulas given in
section 7.2

The calculated HD-index lies significantly above the average, which can also be
deducted from the fact that the male has only two offspring with B2 or below.
The calculated HD-index can be standardized to vary between 50 and 150. The present index is randomly 'standardized' with the factor 100.
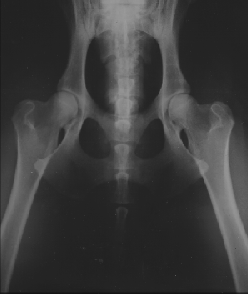
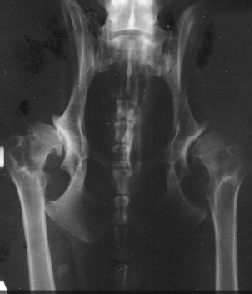
Figure 8.4 shows X-rays of the best hips, A1, and the worst, E2. The pictures have been taken at
Røntgen-Klinikken at KVL.
| Figure 8.4
H-D score, left A1 and right E2. |

 |
From April 2000 The Danish Kennel Club has altered the scale for HD evaluation,
it is now a five-step scale containing only the grades A, B, C, D and E, this
new scale has been adapted internationally. In the present example the HD-index can be recalculated with the new class means 1.02, -.02, -.90, -1.47 and -2.16.
Comparison of occurrence of threshold and Mendelian diseases.
In chapter 5 was given a detailed description of the segregation of Mendelian
diseases within families. All these forms run within families. The same is true for a threshold disease.
For diseases with low population frequency it is not possible to discern between a Mendelian and a threshold disease. In both cases the frequency of the
disease is much higher in individuals closely related to a diseased one, than the frequency in the general population.
The differentiation between the two forms of inheritance can only be done by means of test mating. In case of the Mendelian inherited diseases the exact
segregation ratios can be predicted. This is not the case for threshold traits.
Estimating heritability for threshold traits. In chapter 6 methods for estimating heritabilities for normal distributed quantitative traits
was given. The
heritability can be estimated from a threshold disease when the population frequency is known, as well as the frequency in offspring
of affected animals or
relatives of affected animals.
Figure 8.5
Calculation of heritability based on disease
frequency in relatives of affected animals.
In this
case affected parents. |
 |
Figure 8.5 shows an example of heritability estimation in graphic form.
The frequency in the population is 5 % and the frequency in offspring of
affected animals is 20 %. The situation can be regarded as a
selection experiment, where
only affected animals are selected for breeding. Now the simple formula for delta G
or the selection response, R = S*h2 can be used. The threshold trait is
measured in a standardized normal distribution with S = i. The response R is the difference between X1 and X2.
(They can be looked up in a table of
the normal distribution.) The selection intensity (i) is also in the table of
i. The heritability in this case is estimated to 0,39.
If the frequency of affected animals is known, as for instance in first degree
relatives (father, mother or full sibs), the calculations are carried out as shown in the example, but then h2/2 is estimated as the R/i.
In data from second degree relatives, as for instance half sibs, the estimated
result is h2/4.
A statistic of the present type can also be regarded as an
epidemiological investigation,
the risk factor is relationship to an affected individual. The
relative risk of getting the disease is 4 times larger in offspring of two
affected parents than in a randomly chosen individual in the population shown
in Figure 8.5.
An applet for calculating heritability
of threshold traits
Next page


