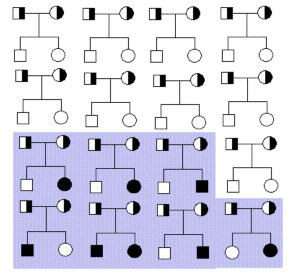
Theoretical segregation of heterozygotic
parents in 7 out of 16 families of two.

When the use of field data is needed, and it concerns newly occurred diseases, only families with affected offspring can be considered. When a segregation ratio for Mendelian inheritance is calculated on the base of such observations, it is necessary to correct for families that due to random chances are not segregating.
| Figure 5.7
Theoretical segregation of heterozygotic parents in 7 out of 16 families of two.  |
In the following are formulas for testing and calculating the corrected segregation in families which have chances of segregation. Therefore the relevant data (shaded area) from Figure 5.7 is:
T = 14   -total number
A = 8   -number of affected
A1 = 6   -number of families with 1 affected
A2 = 1   -number of families with 2 affected
Figure 5.8 shows a path diagram of a mink family from a farm with an outbreak of tyrosinaemia. One of the clinical symptoms is, as shown in the picture, the fact that the eyelids stick together. The whelps die after one or two days with clinical symptoms. The cases occur when the whelp is about six weeks. A description of the disease can be found in Christensen et al. Canadian J. Comparative Medicine, 43:333-340, 1979.
Figure 5.8. Segregation of tyrosinaemia in standard mink (filled symbols), The photo
on the right shows an affected
whelp with the typical sticky eyelids.

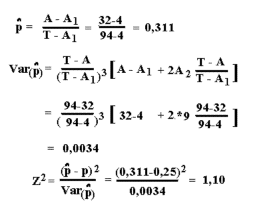
The formulas to apply according to "Singles method" for a test of Mendelian inheritance (for the
proportion p-hat) are shown below. The actual numbers from the tyrosinaemia case, Figure 5.8, are inserted.

T and A are respectively the total number of offspring and the number of affected offspring. A1 and A2 are the number of families with respectively 1 and 2 affected offspring. Z2 is Chi-squared distributed with 1 degree of freedom. P-hat is tested against the expected segregation frequency (p) which in the tyrosinaemia case is 0.25, as it is expected that both parents are carriers.
In the mink family is found that:
T = 94   -total number
A = 32   -number of affected
A1 = 4   -number of families with 1 affected
A2 = 9   -number of families with 2 affected
The calculation is carried out by inserting the actual numbers in the formulas above. There is no significant statistical
deviation from a 3:1 segregation ratio as the test value is less than 3,84 (H0: p(hat) = p =0,25). Families with more
than 2 affected individuals are not directly part of the calculations, but contribute only to the total number of affected.
An applet for the calculation can be found here
If the number from the first theoretical example (Figure 5.7) is inserted in the formula for p(hat) we get (8-6)/(14-6) = 0.25, which is of course the correct result, as the data originated from mating with known heterozygotes.