Put your data in the second line and press the Calculate button.
In the data set 16 litters are included with at least one affected offspring. The observed numbers are given below.
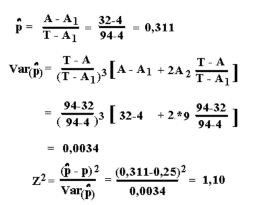
T = 94   - total numbers of pups
A = 32   - total number of affected
A1 = 4   - number of families with one affected pup
A2 = 9   - number of families with two affected pups
The applied formulas for test of Mendelian inheritance by "Singles method" (with the proportion p-hat ) are shown in the figure below. The tyrosinemia data are applied to show the use of the formulas. The results below are rounded, so they are sligthly different from what you get using the above calculator.
The Z2 are Chi-squared distributed with 1 degree of freedom. The test of p-hat is against 0,25, this is the expected ratio when both parents are carrier and there is recessive inheritance. The test value is less than 3.84. Therefore the deviations can be accepted as not statistically significant.
T =  30  - total numbers of observations
A =  16  - total number of affected
A1 = 12  - number of families with one affected
A2 =  2  - number of families with two affected
Is the segregation ratio statistically significant different from 1:3 segregation.