The definition of breeding
value (A) of a male is based
on an infinite number of offspring,
all being half sibs.

The phenotype value (P) of an animal can be measured and evaluated as a deviation from the mean value of the population, P-bar.
The genotype value (G) of an animal equals the phenotype mean value of individuals with the same genotype.
| Figure 6.1 The definition of breeding value (A) of a male is based on an infinite number of offspring, all being half sibs. |
 |
The definition of the breeding value (A) of an individual is based on an infinite number of offspring as two times the deviation of the offspring's mean value from the mean value of the population, when random mating is used. I.e. all offspring are half sibs, see Figure 6.1.
The mean value of the population can be added if the breeding values should be on a normal scale. The definition is valid when it concerns both a specific trait, and the effect of genes on a single locus. The formulas corresponding to the definitions applied on data from a single locus are shown in Figure 6.2. It is a precondition that the locus has an effect on the examined trait and that the average of the animals (with different genotypes) differs from each other. The average of the population can be calculated as a mean value. I.e. the sum of the three genotypes multiplied by their respective frequencies. See the example of weight of mice shown in Figure 6.2.
| Figure 6.2. Definition of breeding value for the genotype A1A1 and it is exemplified by weight of mice depending on the genotypes in a locus. A male with the genotype A1A1 gets an infinite number of offspring after random mating in a population. |
 |
When an animal A1A1 is subjected to random mating in a population, the animal can get two types of offspring, A1A1 and A1A2, as seen in Figure 6.2. The gene from the population determined the genotype in the offspring. The frequencies of the two possible genotypes are equal to the population frequencies p and q.
The mean value of a population or of A1A1's offspring is calculated as:

In the example of the weight of mice ( Figure 6.2), calculation of the mean value of the population (P bar) and breeding value for the genotype A1A1 is shown. A similar breeding value can be calculated for genotype A2A2, which, by random mating in the population, gets offspring of the types A1A2 and A2A2 with the frequencies p and q. These results are derived from Figure 6.2 by mating the population with A2A2 instead of A1A1. Thus the breeding value of A2A2 is 2(12*0.3+6*0.7 - 9,24) = -4,88.
The breeding values of the heterozygotes is the average of the two pure genotypes, as half of its gametes is type A1 and the other half is type A2. The breeding values are often called the additive values, because they are proportional to the number of A1 genes in the genotype.
If the genotype value (G) has a more or less distinct dominance,
the average value of a specific
genotype is not equal to the breeding value (A). But there will be a
rest which is caused by dominance deviations (D).
The degree of dominance is determined by the value of the heterozygote type
compared to the two homozygote
types:
An example of calculation of breeding value (A) and dominance deviations (D)
Below is the results of an example of variation in transferrin locus. In Jersey cows
the genotype tt
yield 2082 kg. milk and cows with the genotypes Tt and TT yields 1882 kg. milk.
Below are the actual numbers, the calculation of the mean value is based on the gene
frequencies p and q, which are respectively 0.67 and 0.33.
Genotype	            TT	     Tt            tt
-----------------------------------------------------------
Kg Milk	           1882           1882          2082
(Genotype)frequence       p2=0.45        2pq=0.44      q2=0.11

And mean value   = 0.45*1882 + 0.44*1882 + 0.11*2082 = 1904 kg
The breeding values are calculated as deviations from the mean values of the population, see scale:
             TT and  Tt   Mean value            tt

             1882   1904                         2082    Original scale
           ---|-------|---------------------------|-->   Genotype scale, kg
             -22      0                          178     Deviation from mean
value


Genotype   breeding value
--------------------------------------------------
                TT  p      Tt   q
TT         2*[(-22*0.67 + -22*0.33) - 0] = -44
Tt              	                   = 22,6 ,mean value of the homozygotes
tt         2*[(-22*0.67 + 178*0.33) - 0] = 89.2
--------------------------------------------------
By random mating in the population the genotype TT gets offspring which are of types TT and Tt with the frequencies p and q. This can be derived from Figure 6.2.
The genotype values are determined as deviations from the population mean (see scale). And the breeding values are calculated according to the definition. Finally the dominance deviations (D) can be determined as a rest as shown below.
Genotype      G  =    A    +   D
-------------------------------------
TT          -22  =  -44    +  22
Tt          -22  =   22,6  + -44.6
tt          178  =   89,2  +  88.8
-------------------------------------
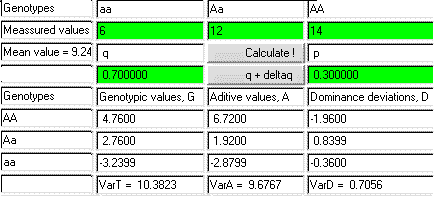
Results derived from using the applet on the example of mice weigths shown in Figure 6.2
 |
It is possible to calculate the variance for a locus. The variance can be caused by the differences in breeding values or in dominance deviations. The variance (V) is calculated as a mean value of the squared breeding values. For instance, the variance of the breeding values: VA = (-44-0)2*0.45 + (22.6-0)2*0.44 + (89.2-0)2*0.11 = 1926, which, in this case, are the breeding values squared and multiplied by the genotype frequency. The average of the breeding values can be calculated as a mean value -44*0.45 + 22,6*0.44 + 89,2*0.11 = 0, which was to be expected.
An applet for calculating G, A and D are shown in the figure above and found
here
Experiments to determine quantitative gene effects are described in chapter 12. Loci,
which has effect on a quantitative trait, are often called QTL's (quantitative trait loci).