Example:
The test example is the transfferin example given in Veterinary Genetics. Jersey cows with the genotype tt yield 2082 kg milk and cows with the genotypes Tt and TT yield 1882 kg milk. The gene frequencies p(T) and q(t) are given as 0,67 and 0,33, respectively.
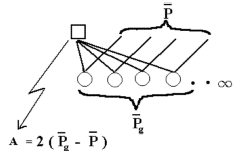
All the values are calculated by the classical formula for a mean value and the breeding value is defined as shown below. To see the results press the Calculate button.
Questions:
Calculate the breeding value and dominance deviation for the gene frequencies p equal .1, .2, .3, .4, .5, .6, .7, .8 and .9 for the following genotypic values
A2A2    100
A1A2    115
A1A1    110
Compare the results, for which gene frequency are there the smallest difference in breeding value between the three genotypes and the smallest additive variance? why ?
The halothane locus (Hal) has influence on the quality of swine meat on the basis of a meat quality index where meat colour is the main component. The average index for the (Hal) genotypes are given below:
			Genotype	Meat-quality-index
			 N/N 	        8.00
			 N/n  	        7.10
			 n/n  	        6.00
Suppose that the frequency of q(n) = 0.20 calculate the following:
a) the average Meat-quality-index for the population,
b) the average Meat-quality-index for offspring from individuals with the genotype N/N respectively n/n supposing adef mating in the population,
c) the breeding value of the three genotypes
d) the additive variance, due to the halothane locus,
e) the proportion of the additive varianceHal of the total additive variance for the Meat-quality-index as its h2 = 0,44 and varianceP =1,69.